
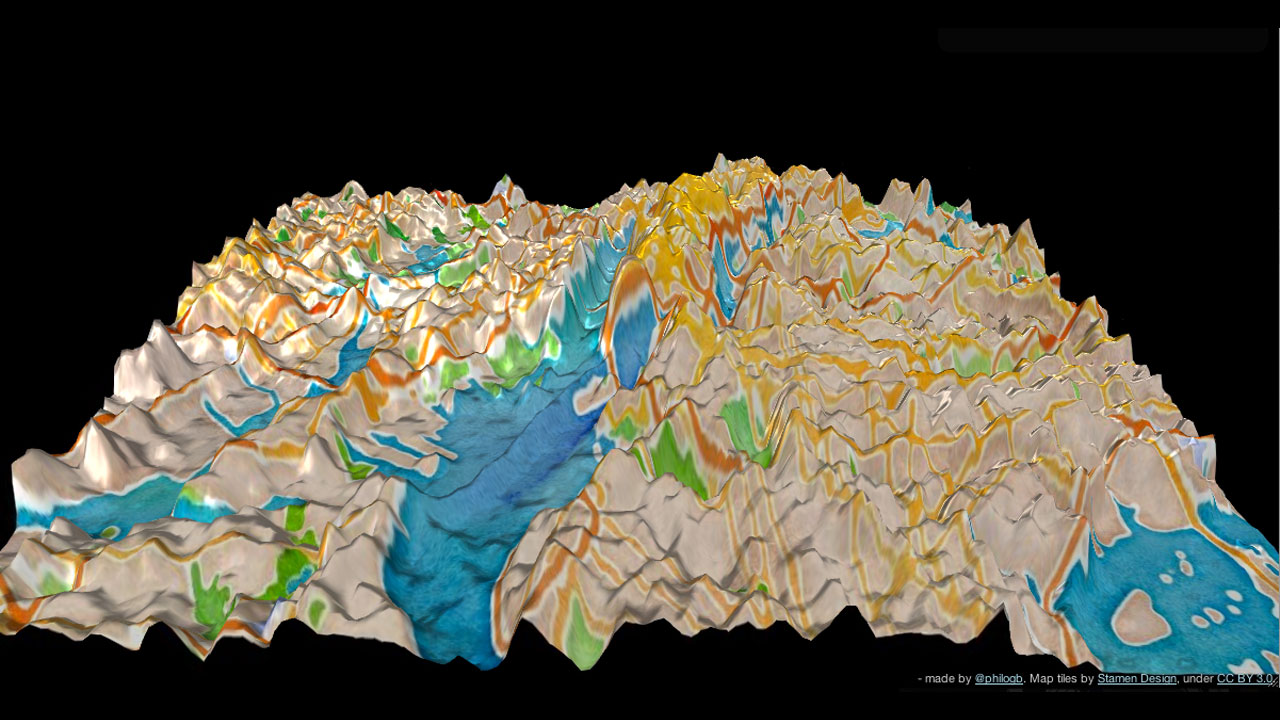
Elevation levels? Latitude? Who cares! Now you can learn the lay of the land based on Twitter activity. Andes is a topographical visualization of geo-located tweets and their frequencies — in New York City (above), San Francisco, and Istanbul.
Created by data visualization scientist Nicholas Garcia Belmonte, the 3D-interactive maps depict Twitter usage as towering peaks — the higher the peak, the more tweets are coming from that location. It’s interesting to see how where the “valleys” of unconnected non-Twitter usage emerge — in rivers and parks, for instance.
But what, you may ask, is the point?
“They’re not made to find an answer to a particular question,” Belmonte told Wired, “But they still provide insights to questions we would have never thought about asking.” Sweet.
