
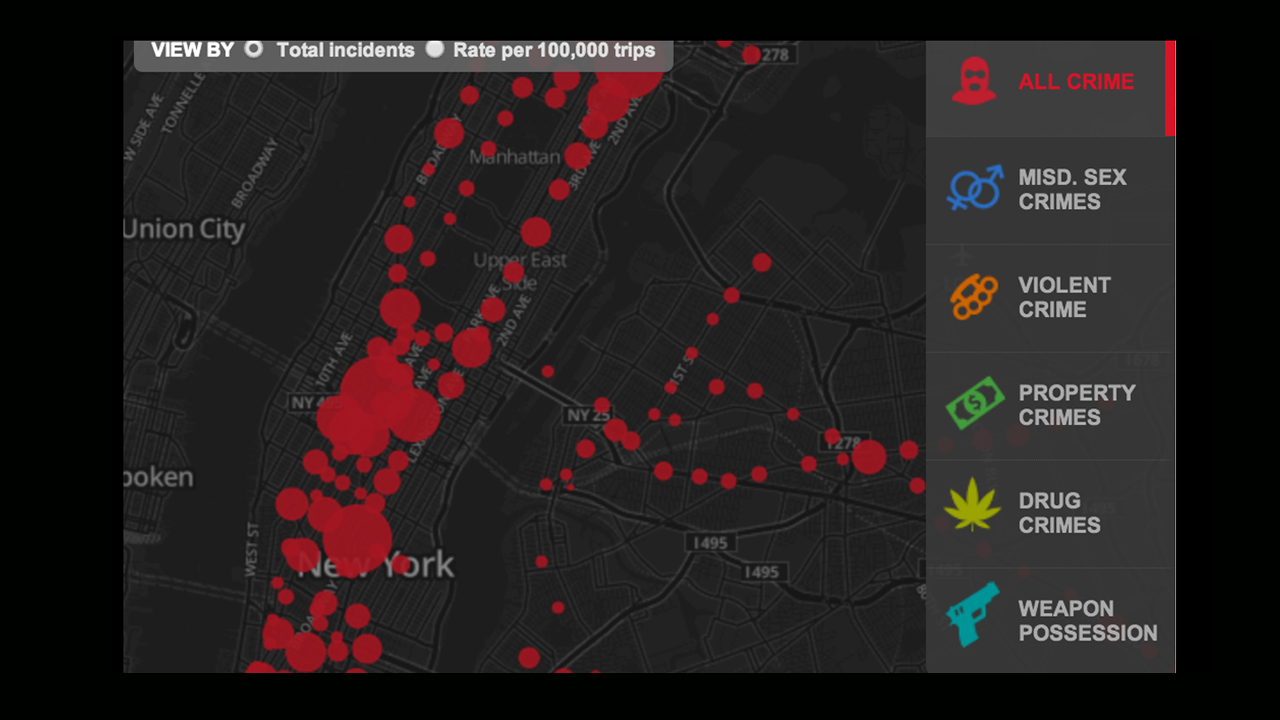
Compiled by the New York Daily News, here’s an interactive map of the various crimes committed on the subway, based on NYPD data recorded between July 2008 and June 2013, obtained via a Freedom of Information Law request.
According to the stats, the annual number of crimes decreased 12% from 2009 to 2012. It’s a nice looking map with a few helpful tidbits. For example, you are most likely to be a victim of a crime late night at Port Authority and at the 125th Street station for the 4,5,6 trains at 3pm, right as school gets out.
But what’s up with using a happy and fuzzy pot leaf as a symbol for all drug crimes? It’s the least druggy of all. See more of the map here.

