
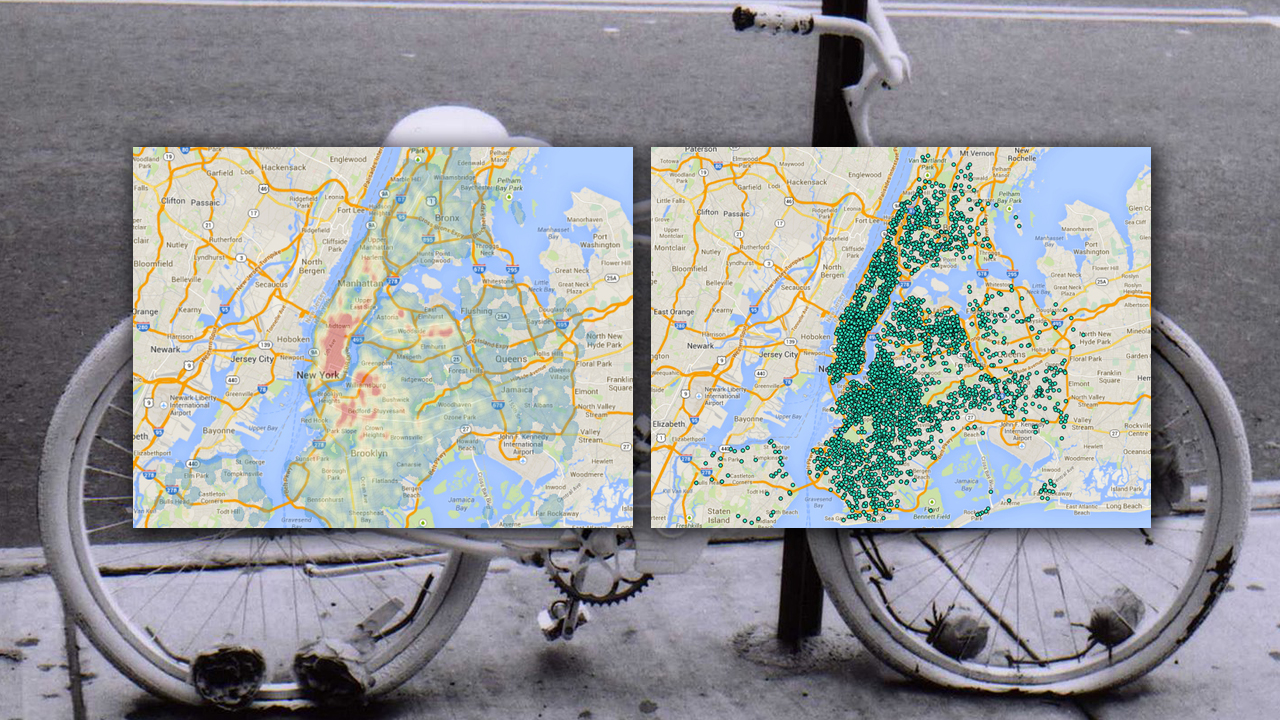
There were 3,800 cyclist injuries reported by the police in 2013. Open data enthusiast Ben Wellington helpfully mapped the data. Each dot on the top right map is a (recorded) accident and the heat map on the top left reveals problem areas like Williamsburg and the entirety of the East Side of Lower Manhattan. He also reviewed the data to map traffic incident fatalities (below), noting:
Sadly, the NYPD makes studying these fatalities extremely difficult, insisting that data only be released in pdf form because the public is not able to understand the data.
Wellington used the NYPD Crash Data Band-Aid, QGIS, Google Maps, a HeatMap plug-in and IPython, which sounds tedious, so thanks, Wellington. But can you make them a little bigger/more legible next time?
If it’s not immediately apparent to the common New Yorker, let’s hope that the same authorities who like to keep this data clandestine are at least trying to do something about Broadway in Brooklyn and Queen Blvd. As has been noted, it’s too easy to kill pedestrians in New York.

