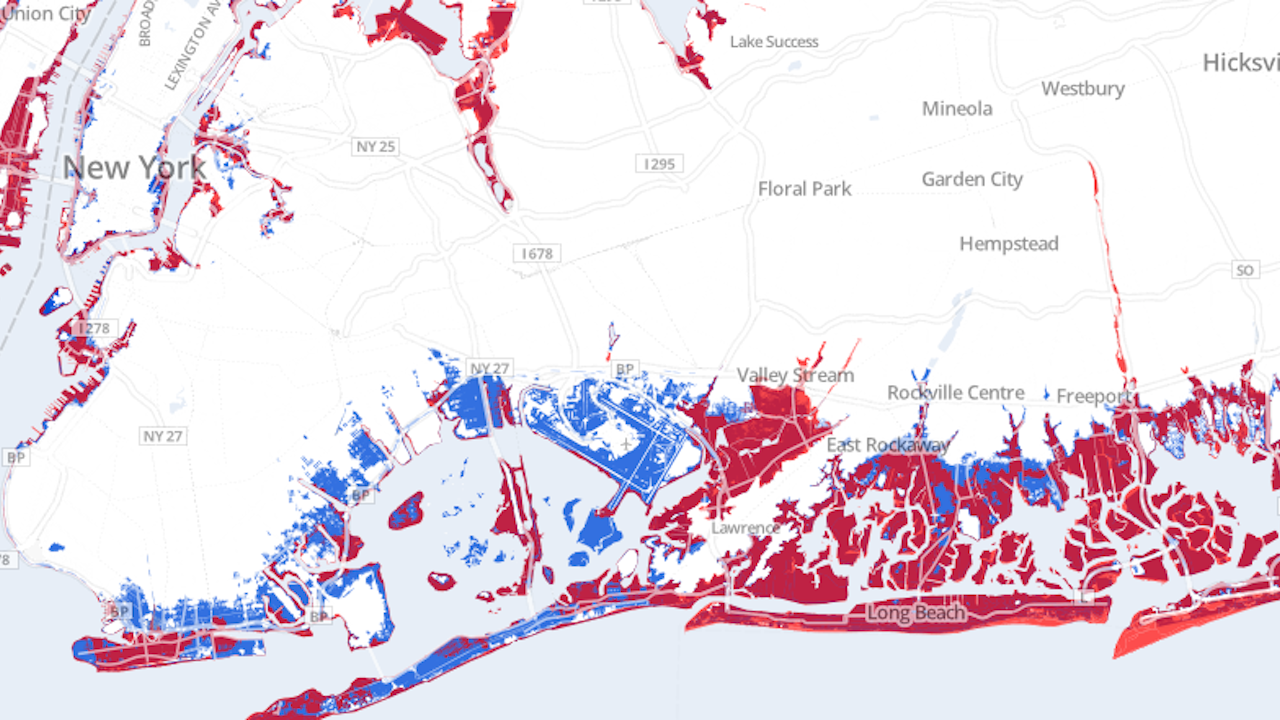
In an effort to understand when and where the “next Hurricane Sandy” will hit, the people at WNYC have created this nice-looking interactive map plotting Sandy’s flooding against “100-year flood zones,” areas which FEMA determined a 1% probability of flooding in a single year. As the map so handily illustrates, Sandy appears to be quite a bit bigger than your average 100-year storm.
NASA scientist Timothy M. Hall and his research partner believe that Hurricane Sandy was more like a 700-year event–with a .14 percent chance of a similar storm hitting New York and New Jersey each year–but cautioned not to get too comfortable, in the wake of rising sea levels. “That will mean, all other things being equal, a 100-year storm will be a storm of just a couple of decades,” said Hall. “A 500-year storm will become the 100-year-storm.”
Check out WNYC’s map below:


