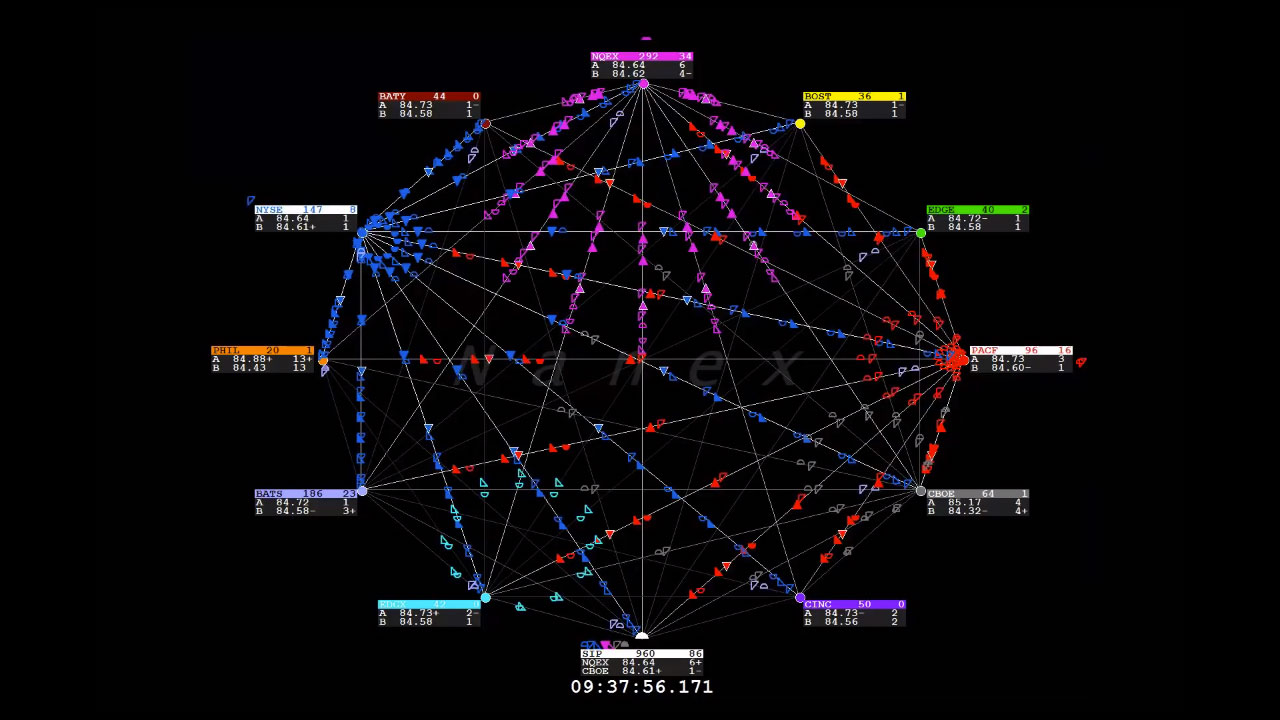
This is 0.5 seconds of Johnson & Johnson trading activity on May 2, 2013. It’s slowed down 720x and stretched out to six seconds. Woah woah woah.
Each box represents one exchange. The SIP (CQS in this case) is the box at 6 o’clock. It shows the National Best Bid/Offer. Watch how much it changes in a fraction of a second. The shapes represent quote changes which are the result of a change to the top of the book at each exchange.
Sorry. Too complicated. Let those who do math control our existence in its entirety. Hurrah capitalism or something.
HAY LOOK! It looks like Geometry Wars, yey! Ooh. Ahh. Game. Pew pew.


