
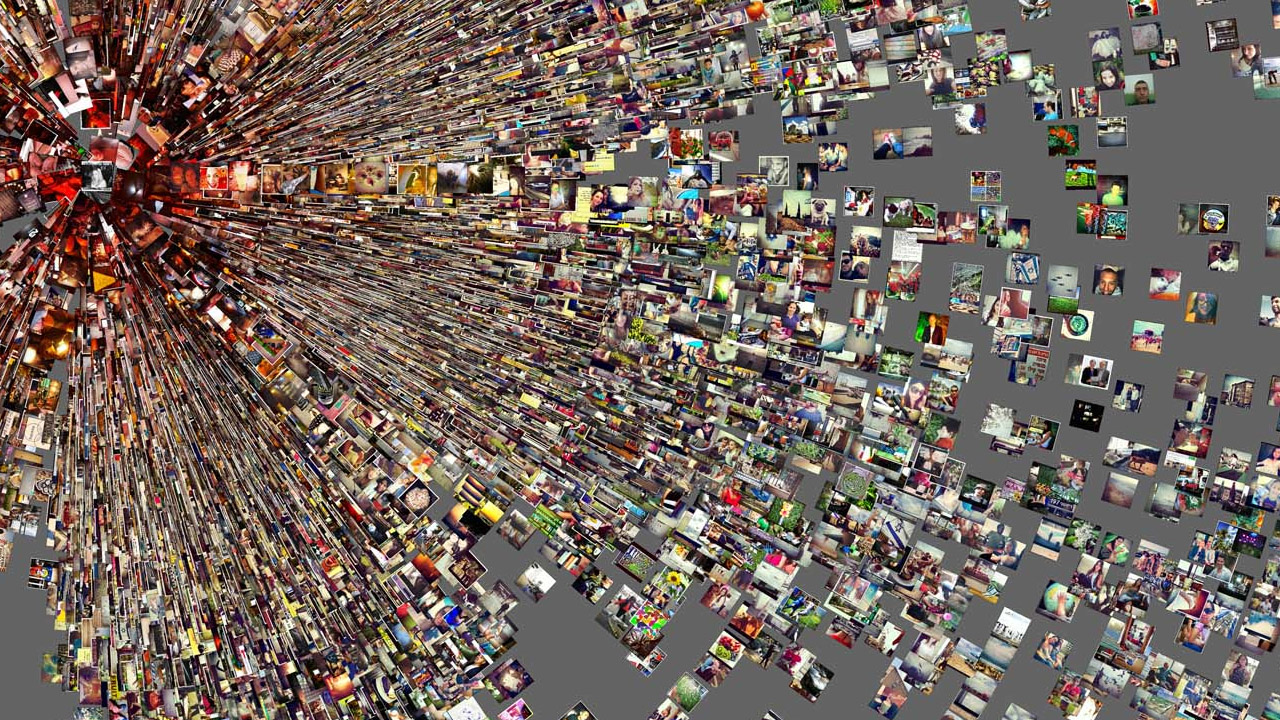
Phototrails is a new research project that uses simple media visualization techniques for exploring patterns and trends found in photos shared on Instagram. A joint venture between the University of Pittsburgh, The California Institute for Telecommunication and Information, and the Graduate Center at CUNY is “seeking to map our city-specific behavior by looking at the thousands of images that pour in each day, particularly on holidays.”

Through mapping out the Instagram photos taken in various cities, Dr. Lev Manovich and Nadav Hochman show that each city has its own unique “visual signature,” a collective style of taking images that is specific to the inhabitants of any given place.
Upon further research, Manovich and Hochman were able to identify cultural differences being mapped through the images being uploaded on certain dates of significance, showing increased use on national holidays and specifically the days following Hurricane Sandy, showing a lasting digital imprint of the trauma that many experienced during the forthcoming months. The project…
…reveals the intensity of the event, manifested in the sudden dramatic decrease in the number of photos and their different colors after the power went out. We see a clear line that separates ‘before’ and ‘after’ the event. This sudden and dramatic visual change reflects the intensity of the experience.
(Images: Fast Company/Visual)
