Tag: Data Visualization
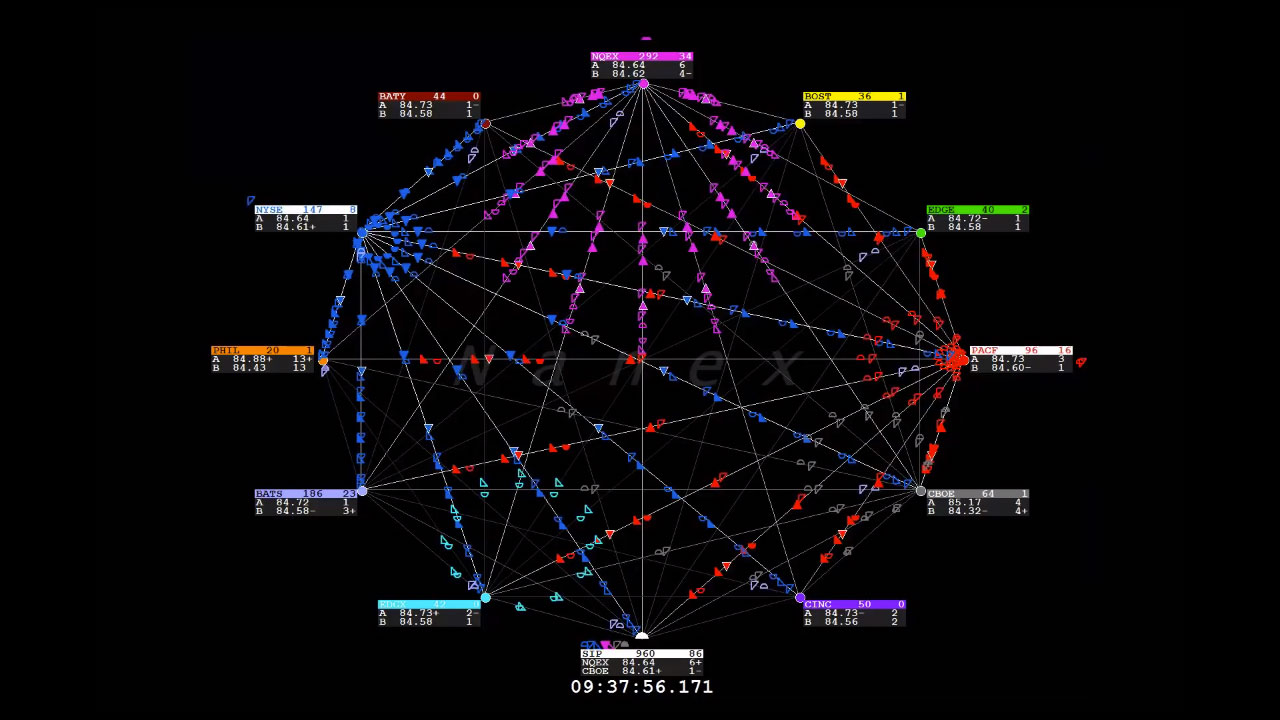
This is 0.5 seconds of Johnson & Johnson trading activity on May 2, 2013. It’s slowed down 720x and stretched out to six seconds. Woah woah woah. Explained: Each box represents one exchange. The SIP (CQS in this case) is the box at 6 o’clock. It shows the National Best Bid/Offer. Watch how much it […]
If you don’t actively use the virtual currency Bitcoin, it can be difficult to truly understand some basic facts about it: Just how widely is Bitcoin really used? How often do people make transactions using the currency, and how big is the average payout? Are we talking about the equivalent of petty cash transactions or […]


 : @danwitzstreetart


 #freights


 (Protest with @citizenactio


