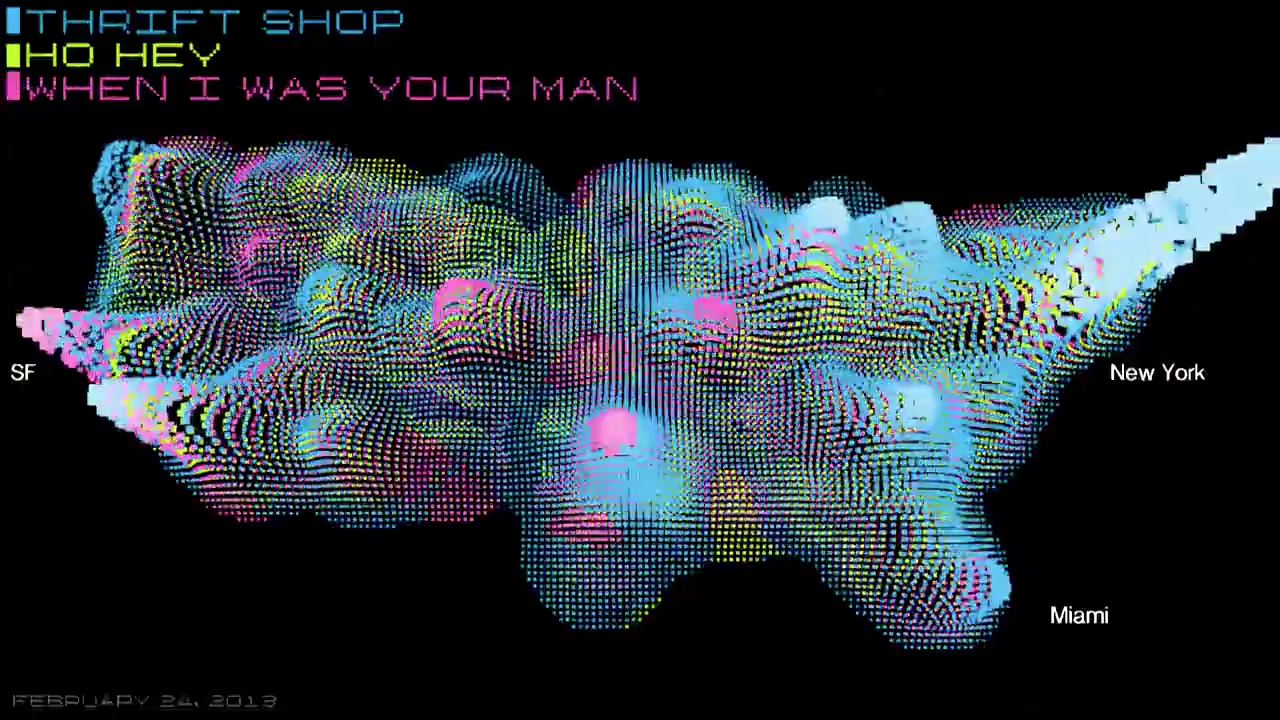
Facebook Stories is a San Fransisco-based project that invites the internet to create something “extraordinary” from that treasure trove of unrelenting, banal social media over-sharing. Their latest project Beatmap uses data collected from song sharing apps that integrate with Facebook Open Graph to map out the ebb and flow of music popularity across our country. Inspired by “old-school graphic visualizers,” the graph comes to life as it depicts the most played songs on Facebook over 90 days.
The result is fascinating — both visually, because it kinda looks like bubbling neon lava and sociologically, because you really get to see how music trends physically spread and fester. Added bonus: It’s like a crash course in social acceptance, if you had no idea people actually listened to this crap.


