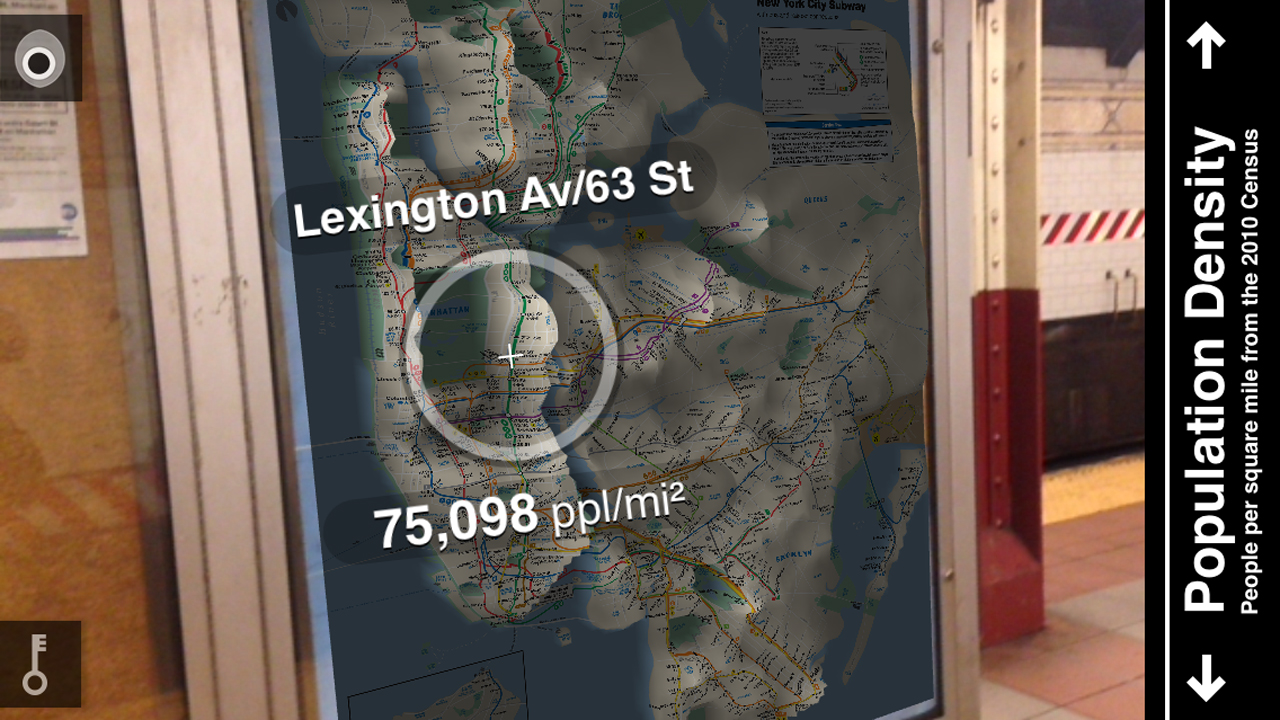
Turn Any NYC Subway Map Into a Dynamic 3D Infographic With This Augmented Reality App
June 11, 2014 | Marina Galperina
One of the greatprojects to come out of NYU’s ITP program, Tunnel Vision is a free app that sources publicly available data and superimposes it on any New York subway map when you move your smartphone over it. You can target very specific part of NYC just by moving your phone over in that direction. It’s pretty amazing.
The turnstile and schedule data from the MTA comes alive in undulating circles and the scheduled trains move along their paths. Above is what population density looks like — a topographical representation in hard 3D ripples, all based on US Census data. There are also graphics representing rent prices and income.
And the best part? You can use it in underground with no reception. We’re going to have a lot of informative, sobering fun with this.
Last week, we showed you this map of Manhattan's best coffee, organized by subway stop. It's a useful resource, but those who live and work in the outer boroughs were out of luck until this week. Thankfully, Butterfruit Labs updated its map today to include western Queens and northwest Brooklyn.…
As designer Andrew Lynch points out, though traditional Subway maps are extraordinarily useful, in the strictest sense, many aren't really maps at all: proportions are skewed in favor of readability, so that the distance between two stops on the map may not truly reflect their actual proximity. With a passion…
Do you tend to plan your daily outings based exclusively on travel time via public transit from Point A to Point B? Do you feel stifled when required to provide a specific destination by websites like Hop Stop and Google Maps? Do you just love being able to rearrange pretty colors…