Tag: Data
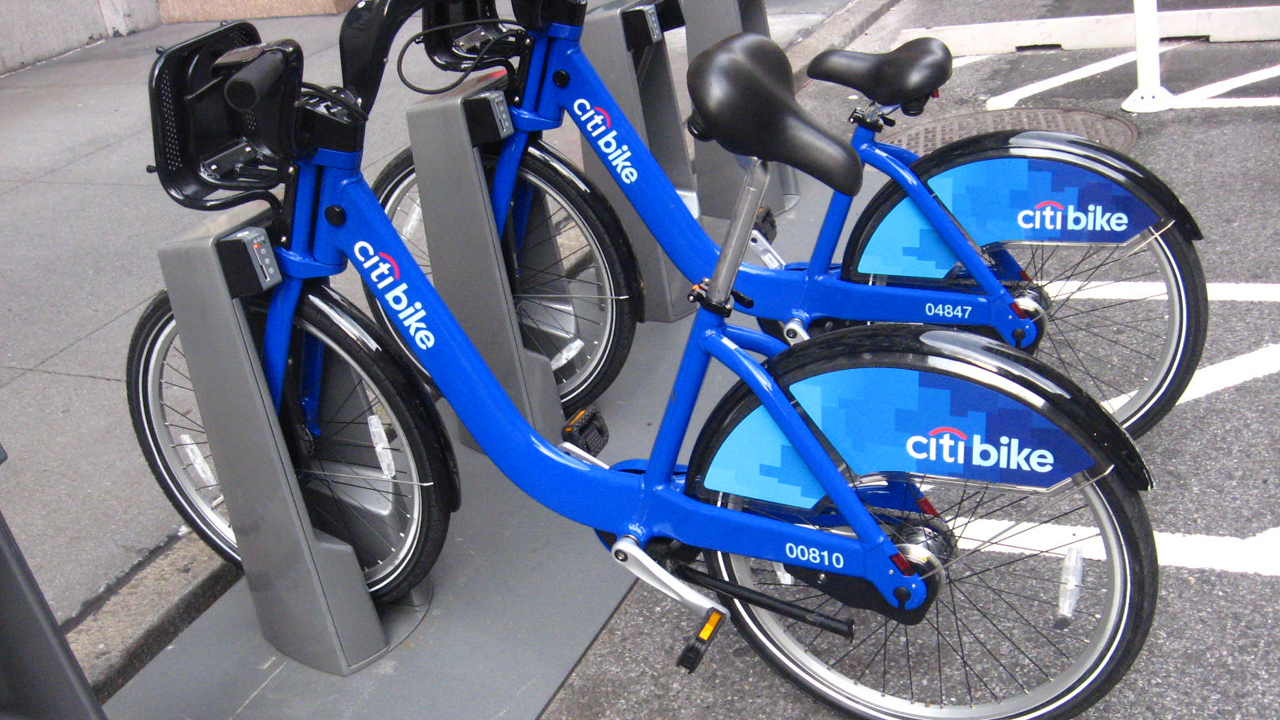
From the data enthusiast who brought you Brighton Beach’s penchant for massage therapy and the worst times for NY traffic (basically, all the times), here is I Quant NY‘s Ben Wellington preparing to try out a Citi Bike — in the safest way possible, utilizing the company’s system data and the city’s vehicle/bicycle collision information. I decided to crunch some numbers […]
Using the same FOIL request that gave us information on every taxi ride from 2013, I Quant NY‘s Ben Wellington bring us some more helpful data analysis. Behold, the best and worst times of the day for traffic in New York. Wellington found that, strangely, there isn’t a real rush hour in the city. Instead, the average speed […]
Healthcare provider data for Medicare reimbursements was recently made public by the federal government. This includes the address of each provider, their name, and the service rendered. Data enthusiast I Quant NY observed some interesting trends in all this information, specifically the seemingly random fact that 25% of Medicare reimbursement for massage therapy happen within the zip code 11229 […]
Since the installation of GPS trackers which record the beginning and end locations of each trip, taxi rides have been automatically creating a massive amount of data. Artists Chris Whong and Andrés Monroy used New York’s Freedom of Information Law to get access to this data, and Eric Fischer — one of our favorite data cartographers — created this map visualization. Here are […]
Bras are the worst. Bra shopping sucks. Victoria’s Secret carries only a select range of sizes, regular department stores’ lighting make you feel like one giant red irritated blob and fancy boutiques where something might actually fit are prohibitively expensive. But us boob-carriers might finally have something to give us hope, Wired reports. True&Co is a […]
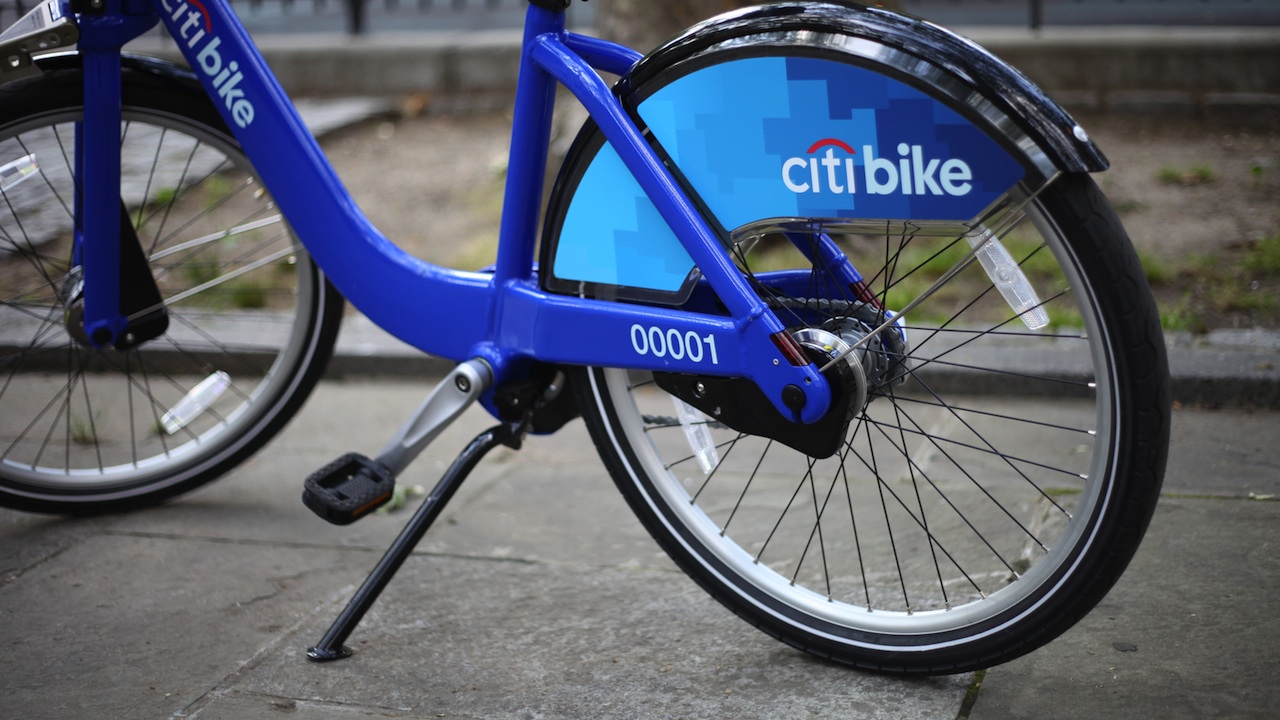
We’re coming up on the one-year anniversary of Citi Bike’s launch in NYC. To celebrate, let’s take a look at what may be the system’s greatest workhorse. The always wonderful NYC data blog I Quant NY crunched Citi Bike’s publicly available data to find bike #17279, which blogger Ben Wellington is calling “the busiest Citi Bike in […]
To get a better sense of which movie crits are worth trusting, the people at Vocativ did a quantitative analysis of the scores they’ve given the 200 top-grossing films of the past 10 years. At the top of the chart are the critics who are inclined towards fawning, at the bottom are those who, in […]
You’re in Manhattan and jonesing for a Venti Double Chocolaty Chip Frappuccino®. Quick, where’s the closest Starbucks? Chances are, it’s four blocks away or less. The data blogger Ben Wellington of I Quant NY plotted the location of every Starbucks on the island, then measured the distance between each Manhattan’s lots and the closest outpost of […]
The Atlantic Cities conducted a study of poverty and segregation in major metros across the country, and unsurprisingly, NYC has it pretty bad. The study looked at income and geography to find the cities in which poor people live in the most concentrated, isolated areas, and while New York isn’t the worst — that dubious honor goes […]
The porn-centric big data project Sexualitics created Porngram, a nifty tool that lets you chart the frequency of terms that show up in pornos uploaded to xHamster between 2007 and 2013. Just enter two terms — “MILF,” and “teen,” for instance — and you’re given a simple line graph showing how their popularity shifted over […]


