Tag: Maps
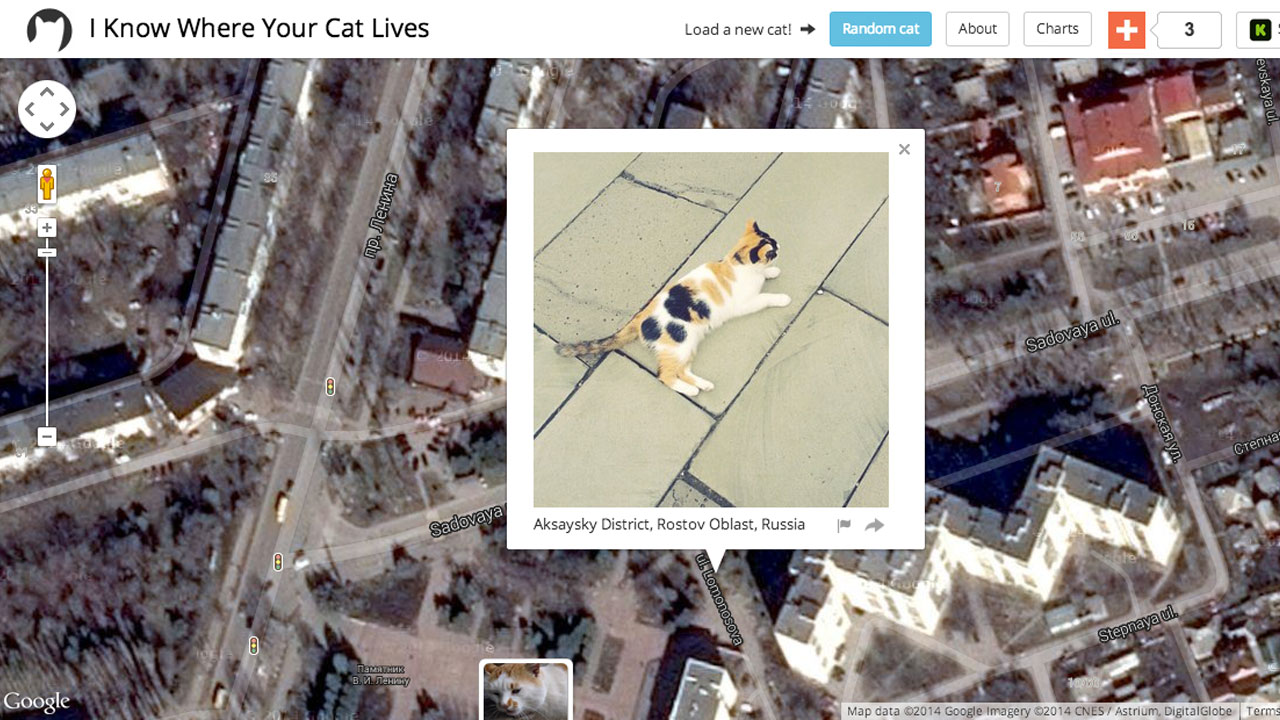
If you post photos of your cat on social media, the internet probably knows exactly where your cat lives. And, unless your cat has its own place, that’s probably where you live too. Florida State University professor Owen Mundy was trying to tell you this when he created I Know Where Your Cat Lives — an interactive map […]

This summer has been pretty nice so far, by NYC standards, with sporadic and bearable heat waves and most of the extreme weather consisting of freak thunderstorms. Lucky 2014. Prepare yourselves for Nelly to make a big comeback, ’cause it’s getting hot in here in the future. Climate Central has created an interactive map that shows […]
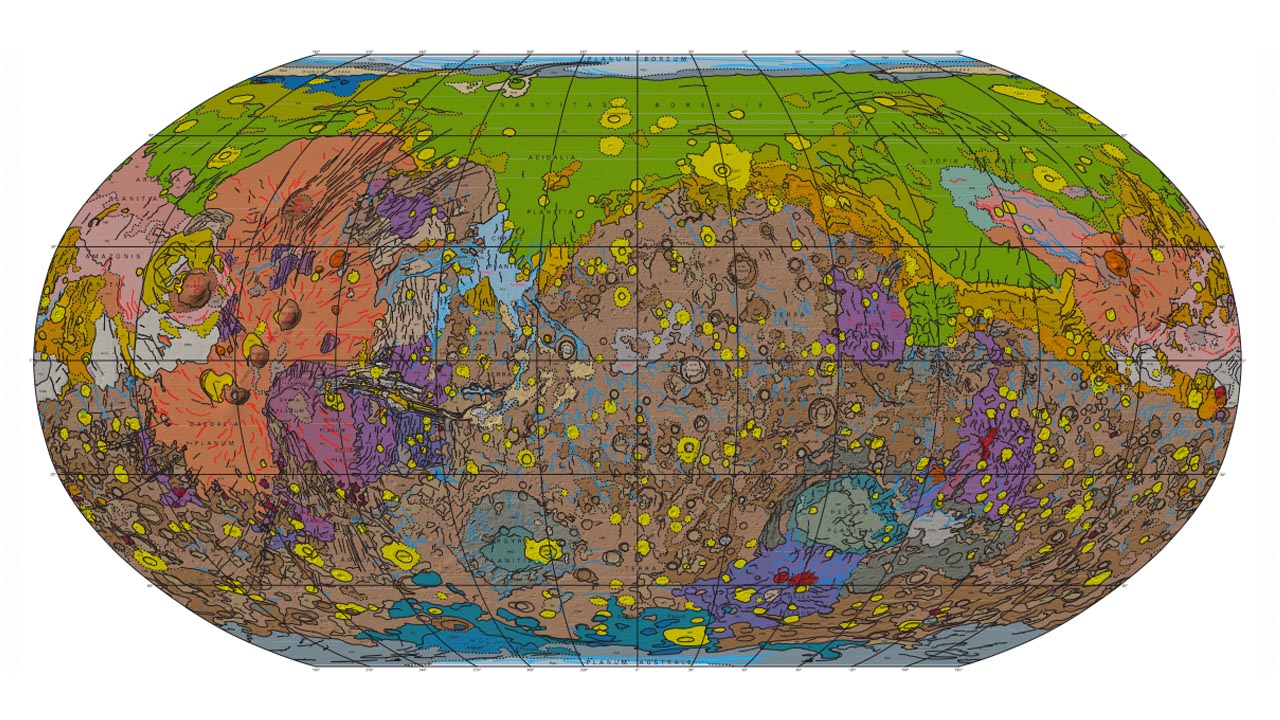
A new map of Mars produced by the US Geological Survey (USGS) is the most detailed yet, revealing new nuances about the planet previously unknown to science. The data was captured by three different spacecrafts — the Mars Global Surveyor, Mars Odyssey and the Mars Reconnaissance Orbiter. The colors of the crust represent various processes that created […]
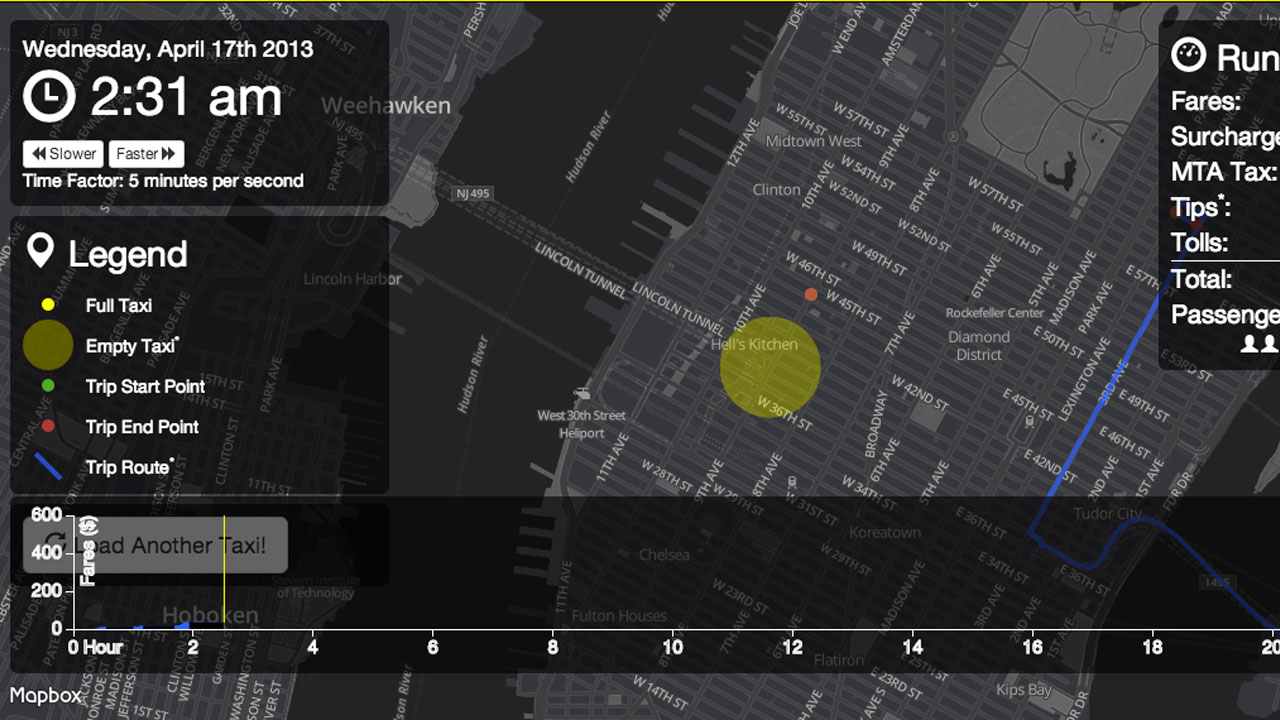
Previously, we posted a map that plotted every taxi trip made around New York in 2013. Now, Chris Whong has given us a tiny crisp slice of that mass blur of data. NYC Taxis: A Day In The Life, is an interactive map of the trips taken in one day in 2013 by a single yellow […]
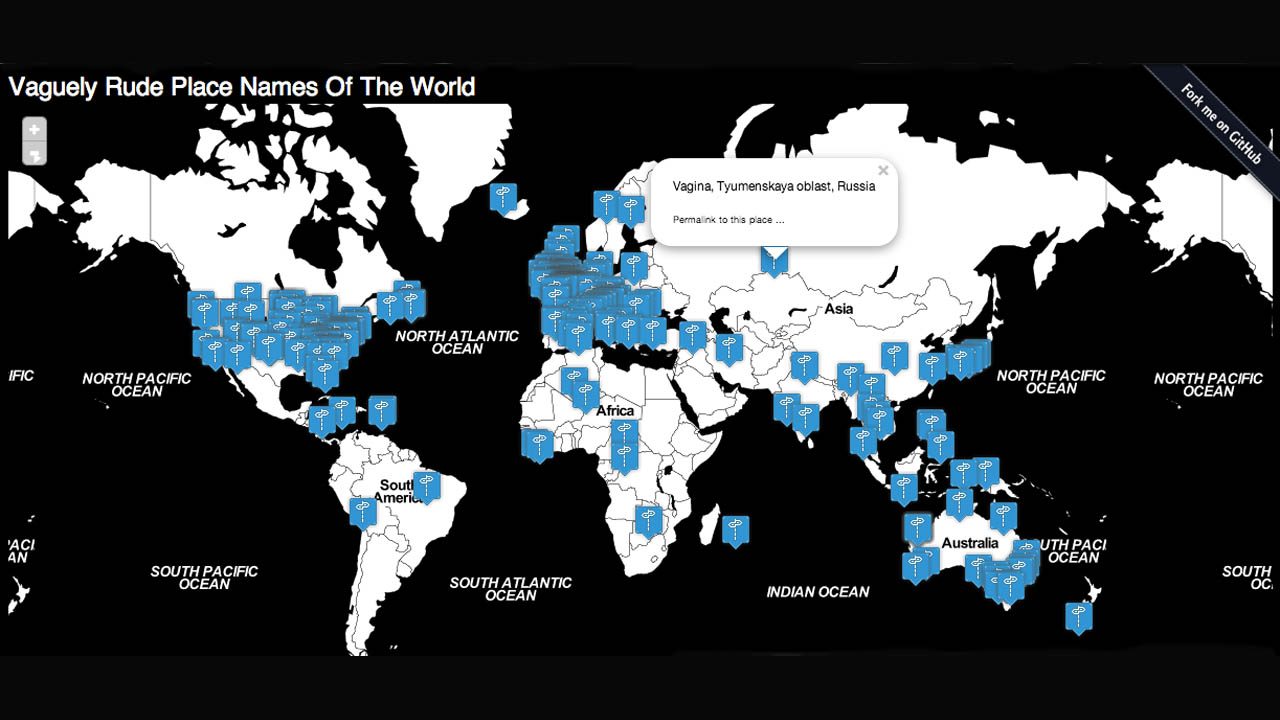
Gary Gale used OpenStreetMaps to create something we all needed — a map of the dirtiest-sounding locations on Earth. The 13-year-old boy in us all shall rejoice as we peruse landmarks including the town of Poo in Spain, Wet Beaver Creek, Arizona and Semen, Indonesia. And let’s not forget the Russian city of Vagina. As FastCo […]
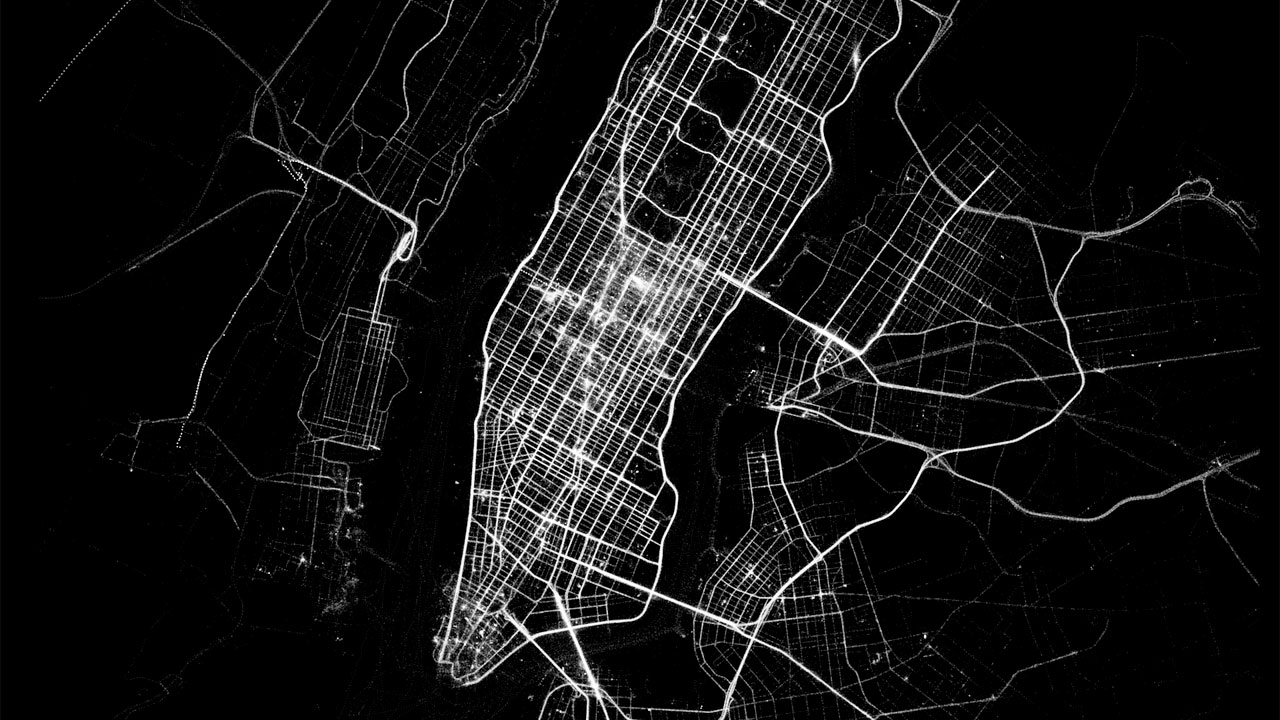
The activity tracker app Human has created a set of beautiful maps that show the movement of a city in a day period. These luminescent maps were created with the data collected from people using the app as they moved around major cities by walking, running, biking and motorized transport. The maps fade in from black to outline […]
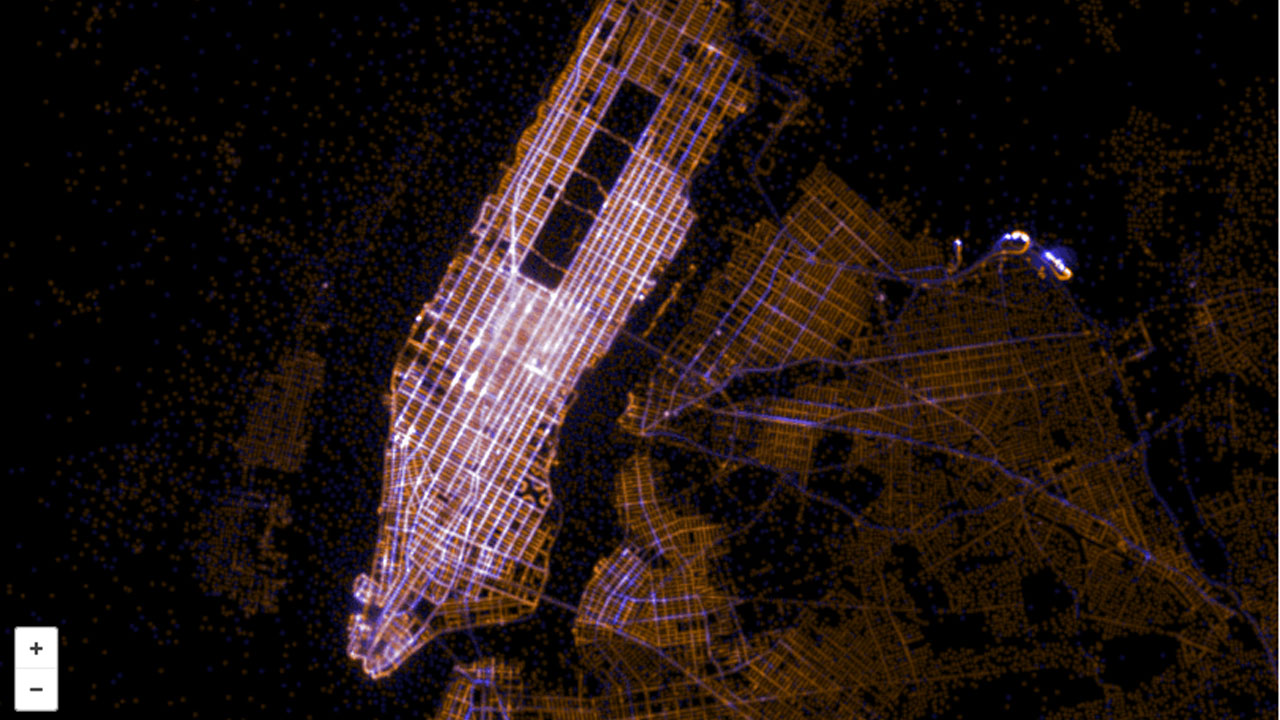
Since the installation of GPS trackers which record the beginning and end locations of each trip, taxi rides have been automatically creating a massive amount of data. Artists Chris Whong and Andrés Monroy used New York’s Freedom of Information Law to get access to this data, and Eric Fischer — one of our favorite data cartographers — created this map visualization. Here are […]
A small German company Blitzortung has created a real time map of lightning strikes over much of the world, all for free. Their spread out detectors help them determine the location of a lightning strike in seconds. The Vane explains: Let’s say there’s a thunderstorm over Dallas and a brilliant bolt of lightning strikes the center of […]
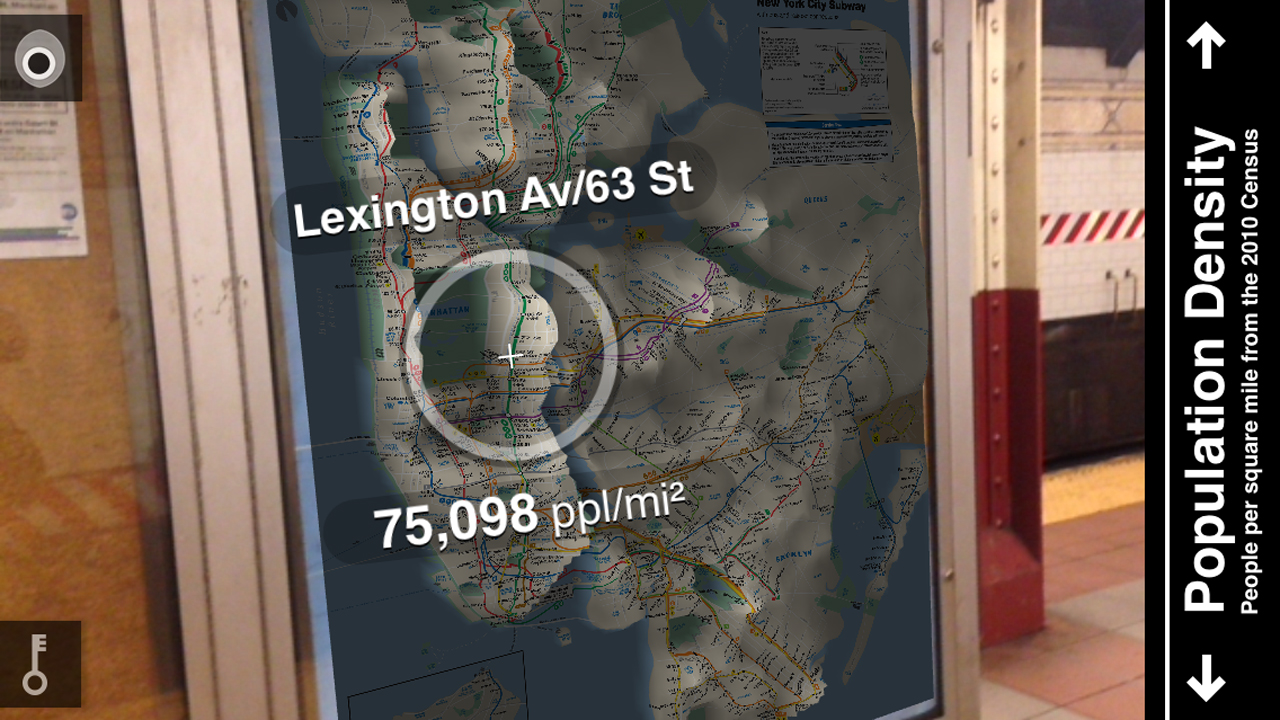
One of the great projects to come out of NYU’s ITP program, Tunnel Vision is a free app that sources publicly available data and superimposes it on any New York subway map when you move your smartphone over it. You can target very specific part of NYC just by moving your phone over in that direction. It’s […]
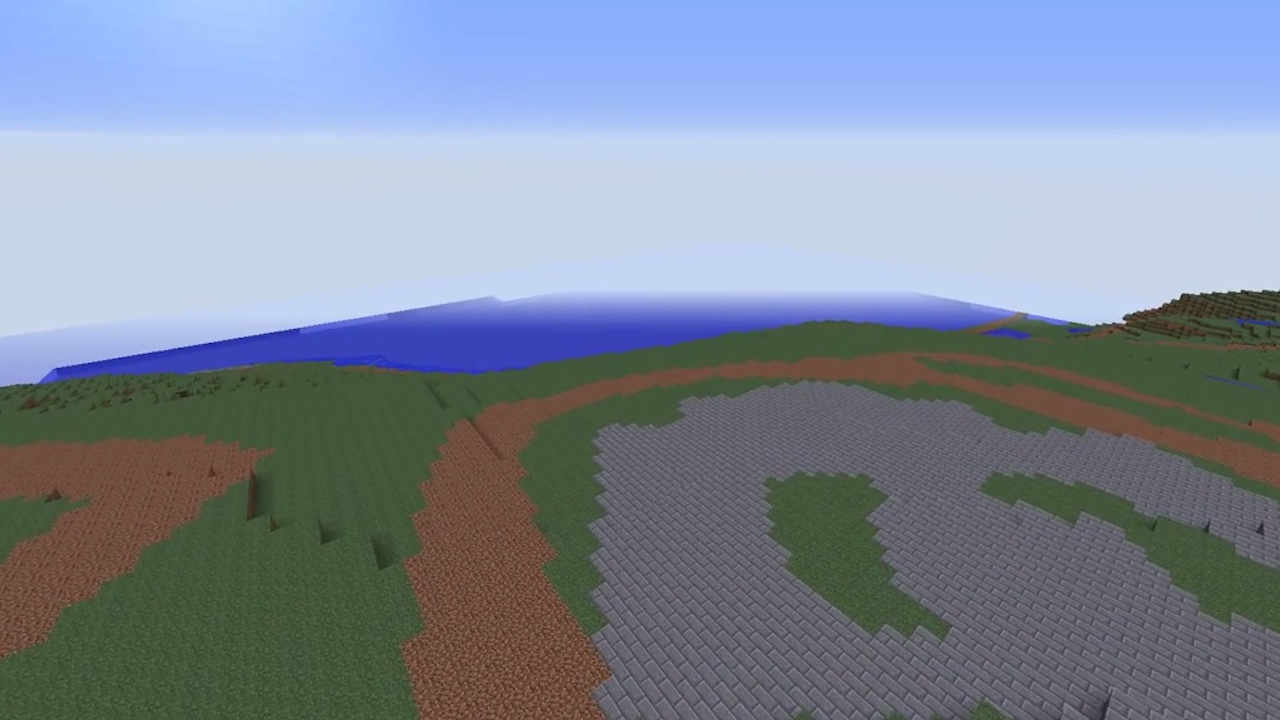
Recently, developers at the New York Public Library dipped into the institution’s vast archive of historical maps and converted a tract of uptown Manhattan land into a Minecraft world. The video above shows Fort Washington — near 160th Street and the Hudson River — as it looked in 1860, according to the vintage contour map […]